LinkedIn Analytics Crash Course – Grow through data
Why network on LinkedIn?
LinkedIn is a unique social medium in that it does not look very “social.” You are unlikely to find pet or even family photos there. Instead, you will find resume-type personal profiles and company pages.
LinkedIn is a platform where professionals seek to find jobs or attract clients for their professional services. Companies seek to build their brands and also look for highly skilled employees on that platform. Businesspersons might also hope to find partners on the platform.
Personal Profiles and Company Pages
If your goal is to gain personal visibility as an expert, you create a personal profile at LinkedIn. It will be a resume to showcase your education, experience and the results you have achieved. The profile can help you find employment, or clients, or business partners.
On the other hand, if your goal is to gain visibility for your company brand, you create a company page. On that page you showcase the value you deliver and the values you hold, as well as company news and product launches.
High quality, thought-leadership content can help both persons and companies to build their image as experts in their field. LinkedIn makes it easy to publish articles. The library of articles will be available to visitors at your profile or page. This is an excellent way to build your credibility.
Analysing Your Personal Profile
You can access data about your personal profile in four ways:
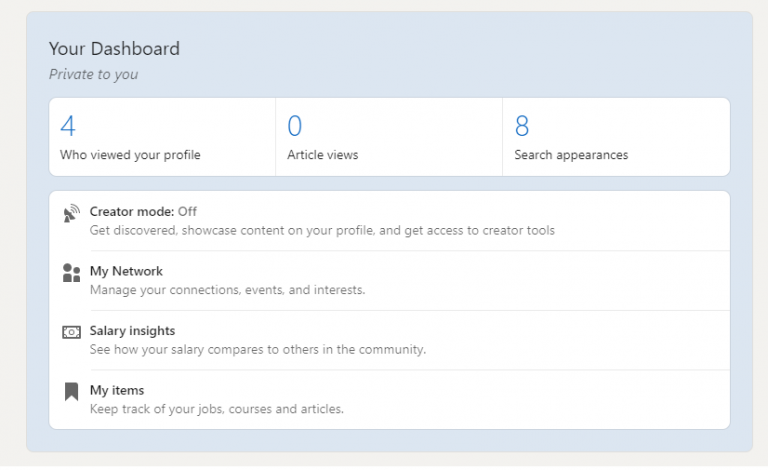
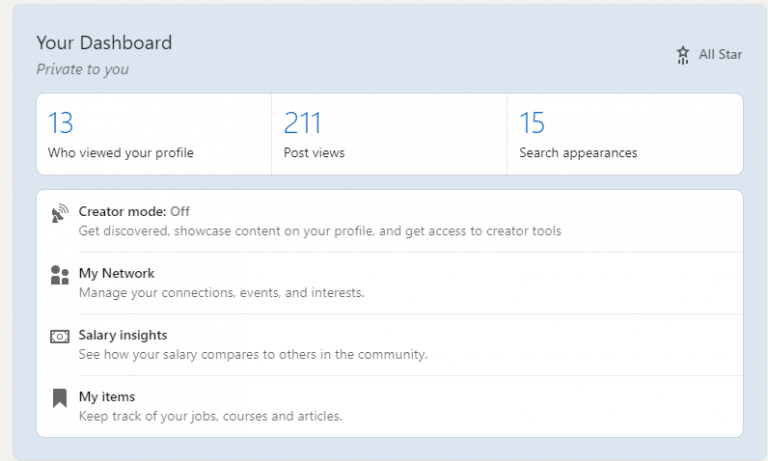
- As you log into LinkedIn, ensure that you’re on your personal profile. Scroll down until you see “Your Dashboard” where you’ll see your personal engagement stats, known as “Personal Insights”:
- Who viewed your profile, i.e., the number of people who viewed it
- Views of your posts, another number indicating how many times your content was viewed
- Search appearances – How many times you showed up in a Users search results
By clicking on the first box, you go to a page that shows the people who viewed your profile (you will need to upgrade your LinkedIn membership to see all the details).
By clicking on the second box, you land on your Article analytics page, also labelled “Post views” if any exist.
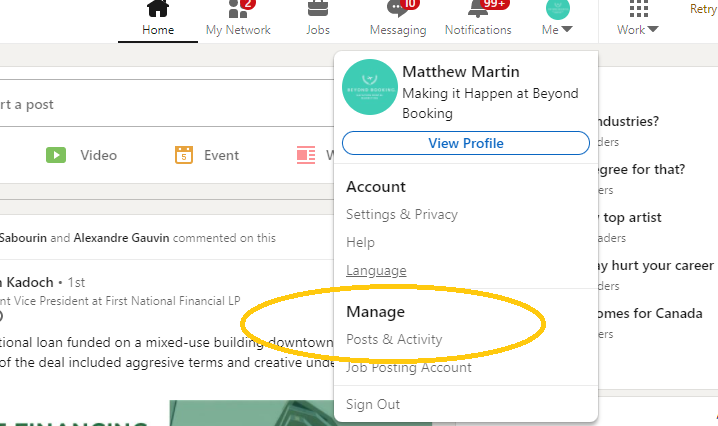
2. In the top row, towards right, you will find your profile photo and the word ‘Me’ under it. Click on the down-pointing arrow against the ‘Me.’
A dropdown box appears (see the box below “Me” in the graphic above). Click the link titled “Posts & Activity” (under Manage).
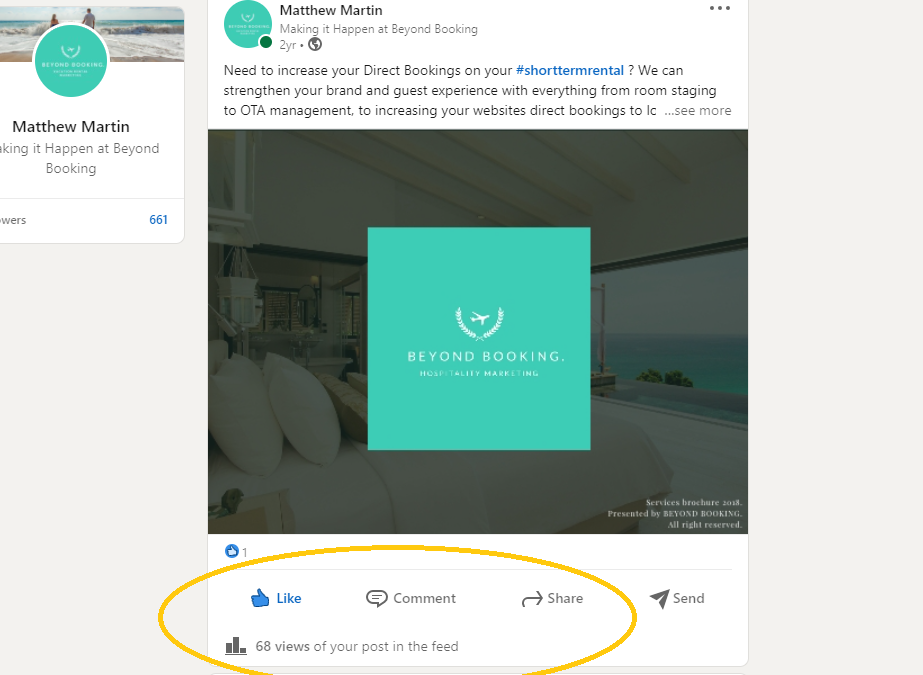
The landing page shows your activity – your posts, shares and more. You will find buttons labelled ‘All activity’, ‘Articles’, ‘Posts’ and ‘Documents’ at the top. By default you will be on the ‘All activity’ page. By clicking one of the other buttons, you can narrow down to a specific section, such as your posts.
Below each activity, you can see some statistics such as ’28 views of your post in the feed.’ By clicking on the statistic, you land on a page that shows the company, job title and location of people who viewed your posts (provided the activity occurred within the last 180 days; LinkedIn does not keep it beyond that.) If people have Liked your content, click on the number of Likes to see who liked it.
3. A third option to see profile statistics is to go to your profile page (Click Me as above, and then click View Profile). Scroll down the page to see a Dashboard that summarises the data, including the number of times your profile appeared in searches.
By clicking the number under Searches, you can see company and job title of people who did the searches, and the keywords they used to search.
4. A final statistic is about your followers. Go to the All Activity page (mentioned above) and you will see the number of your followers under your profile photo. Click on the number and you can see all the people who are following you. You can go to their LinkedIn profiles by clicking on their profile photos.
That is about profile analytics. Let us now look at company page analytics
Company Page Analytics
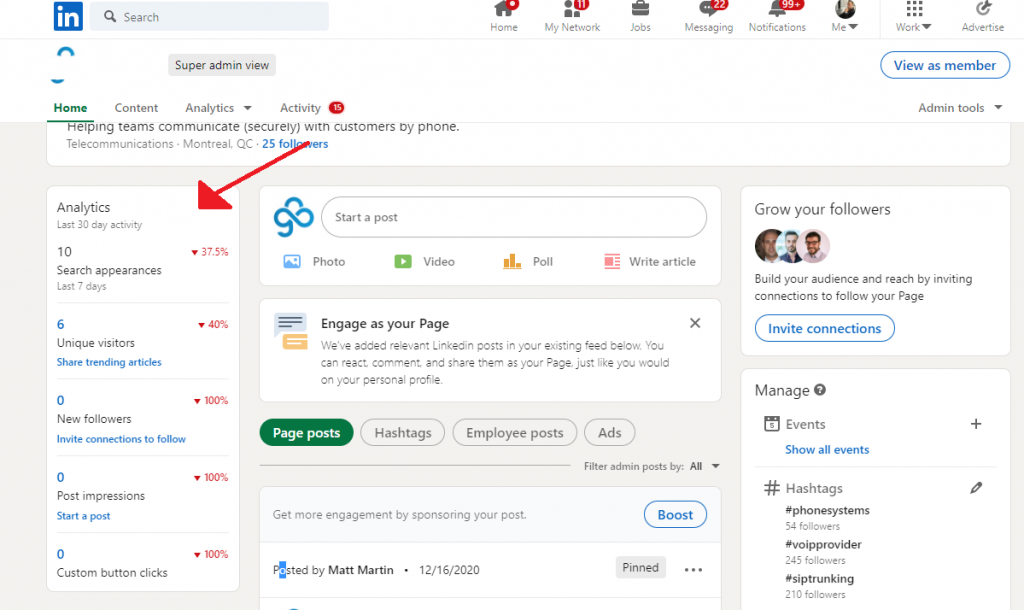
If you have a company page, you can access analytics in a much more straightforward way. Go to the company page and you will find something like the following:
Visitors: Broad data about the people who visited your company page:
Page views: How many times was your page viewed?
Unique visitors: Excludes multiple visits from the same visitor so that you can see how many real visitors landed on the page.
Visitor metrics: Shows the trend of page views over a time period in a graphic format
Visitor demographics: Characteristics of the people visiting your page
Updates: Updates are all the activities on the page, and includes activities by you and activities of visitors, and ends with a look at how well your activities are being received by your audience:
Title: Title of the update, viz. title of the article, news, tips or other update
Posted by: If you have a team doing the work, this shows who among the team posted the update
Created: Date of the update
Video views: A video update is considered as “viewed” if it is viewed for more than three seconds, or its Call to Action button was clicked
Clicks: Number of times the update or company branding was clicked
CTR: Click through rate, the percentage of clicks to number of page views, known as impressions (three separate views by the same visitor counts as three impressions)
Likes: Number of likes for the update
Comments: Number of comments on the update
Shares: Number of shares of the update
Follows: Number of people who followed you from sponsored updates
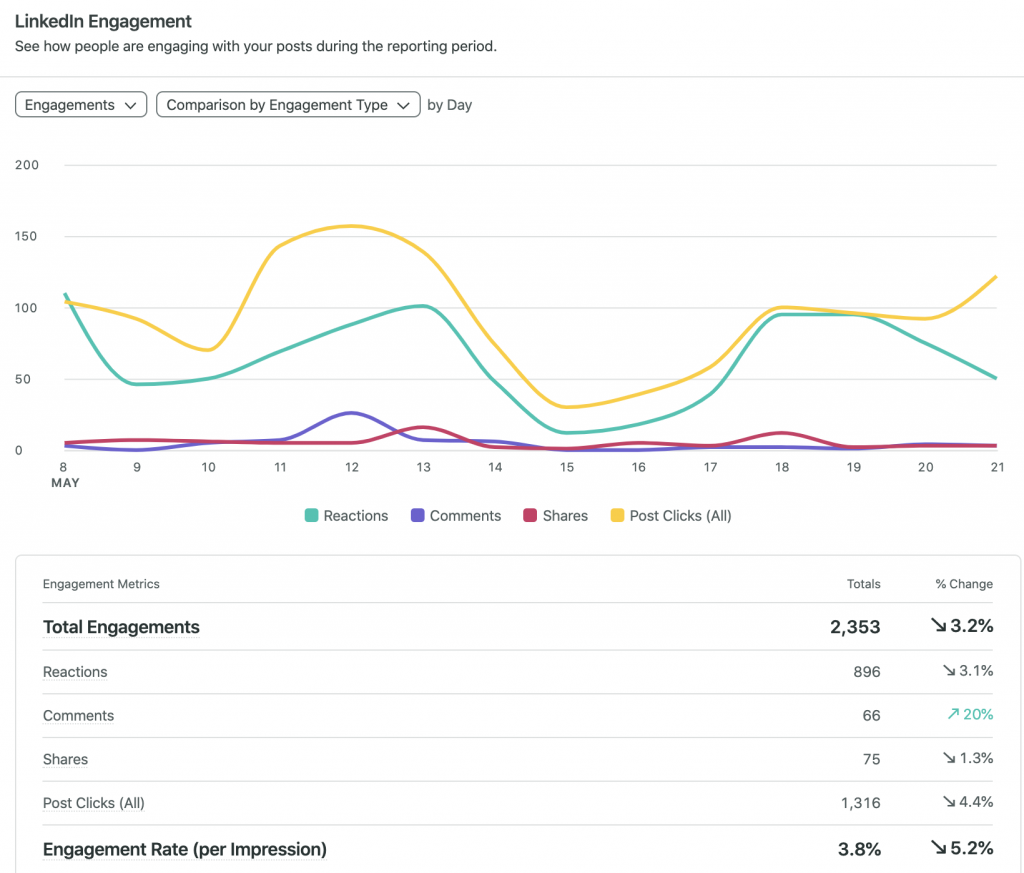
Engagement rate: (Clicks + Likes + Comments + Shares + Follows)/Total number of impressions
Followers: Followers are visitors to your page who were interested enough to click the Follow button on the page. Not all visitors to your page will become followers. Instead, your content must make them want to see more such content. Data provided by LinkedIn about your followers include:
Total followers: This is the number of people who are following your page, including both organic and sponsored followers
Organic followers: This is the number of people who had become followers without you having to spend on advertisements
Sponsored followers: The number of followers you acquired through advertisements
Follower demographics: An analysis of your followers by factors like Location, Job function, Industry and Company size
Follower trends: A graphic showing the acquisition of followers over time
Employee Advocacy: If a company’s employees create content about the company, their followers will come to see it. This is a way for the company to increase its visibility. Done in a planned manner, it could help build the company’s brand image. Creating such a plan and then getting employees to create the right kind of content about the company is thus a part of the company’s marketing effort. The Employee Advocacy section of LinkedIn Analytics shows this effort and its success.
Recommendations: This sub section includes the Posts, and Reactions, Comments and Re-shares of the company’s recommendations
Employees posting from recommendations: Shows the location, seniority and job function of the employees creating posts in response to the recommendations
LinkedIn members reached: Shows the Seniority, Industry, Location, Job function and Companies of LinkedIn members reached by the posts
Recommendation engagement: Reviews the response to each recommendation by the company – its title, created by, date created, posts, impressions, reactions, comments and re-shares
Insights from LinkedIn Analytics
A lot of data is available from LinkedIn Analytics (known as “insights”). However, the whole exercise can turn out meaningless unless you are able to gain actionable insights from the data. How do we derive such insights?
We can start by looking at the key elements of effective marketing. Marketing becomes effective when:
- Your marketing communications reach the right audience. If you want to reach entrepreneurs, it might not help if you reach only students looking for essay material
- The audience finds your content engaging and decides to stick with you by following you or connecting with you
- The content generates desired results, such as getting the reader to contact you or even better, buy immediately from you
How does LinkedIn Analytics data help with the above?
- Visitor Metrics graph gives you an idea whether your page is attracting visitors. This is the starting point of any online marketing campaign
- Visitor Demographics let you check whether these visitors are likely to become your customers
- Engagement Rates (and its components) can generate a clear idea of the type of content that resonates with your audience
- Follower Trends can indicate whether the content is good enough to generate actions from the audience
- Follower Demographics can confirm whether your audience are real prospects for your business
- Organic and Sponsored Followers data can tell you how to get followers effectively
- Employee Advocacy data will indicate how to tap the potential of your employees for enhancing your marketing efforts
Conclusion
LinkedIn is unique among social media because it is designed for professional networking rather than socializing. Even the personal profile at LinkedIn is designed for professional use.
In addition to a personal profile, you can also create company pages at LinkedIn. These pages can be used as effective brand building tools.
LinkedIn Analytics has four broad sections: Visitors, Updates, Followers and Employee Advocacy. We looked at the different data generated by each section.
We concluded with a look at how to use the date in a meaningful way to achieve your marketing objectives.


