
It's built to reward a daily visit, not a monthly one. The top of the page is a feed of things that happened; the deeper analytics sit lower down, ready when you want them.
How to Access
Click Dashboard at the top of the sidebar. It's the first page you see after logging in, unless your account still has onboarding steps to finish.
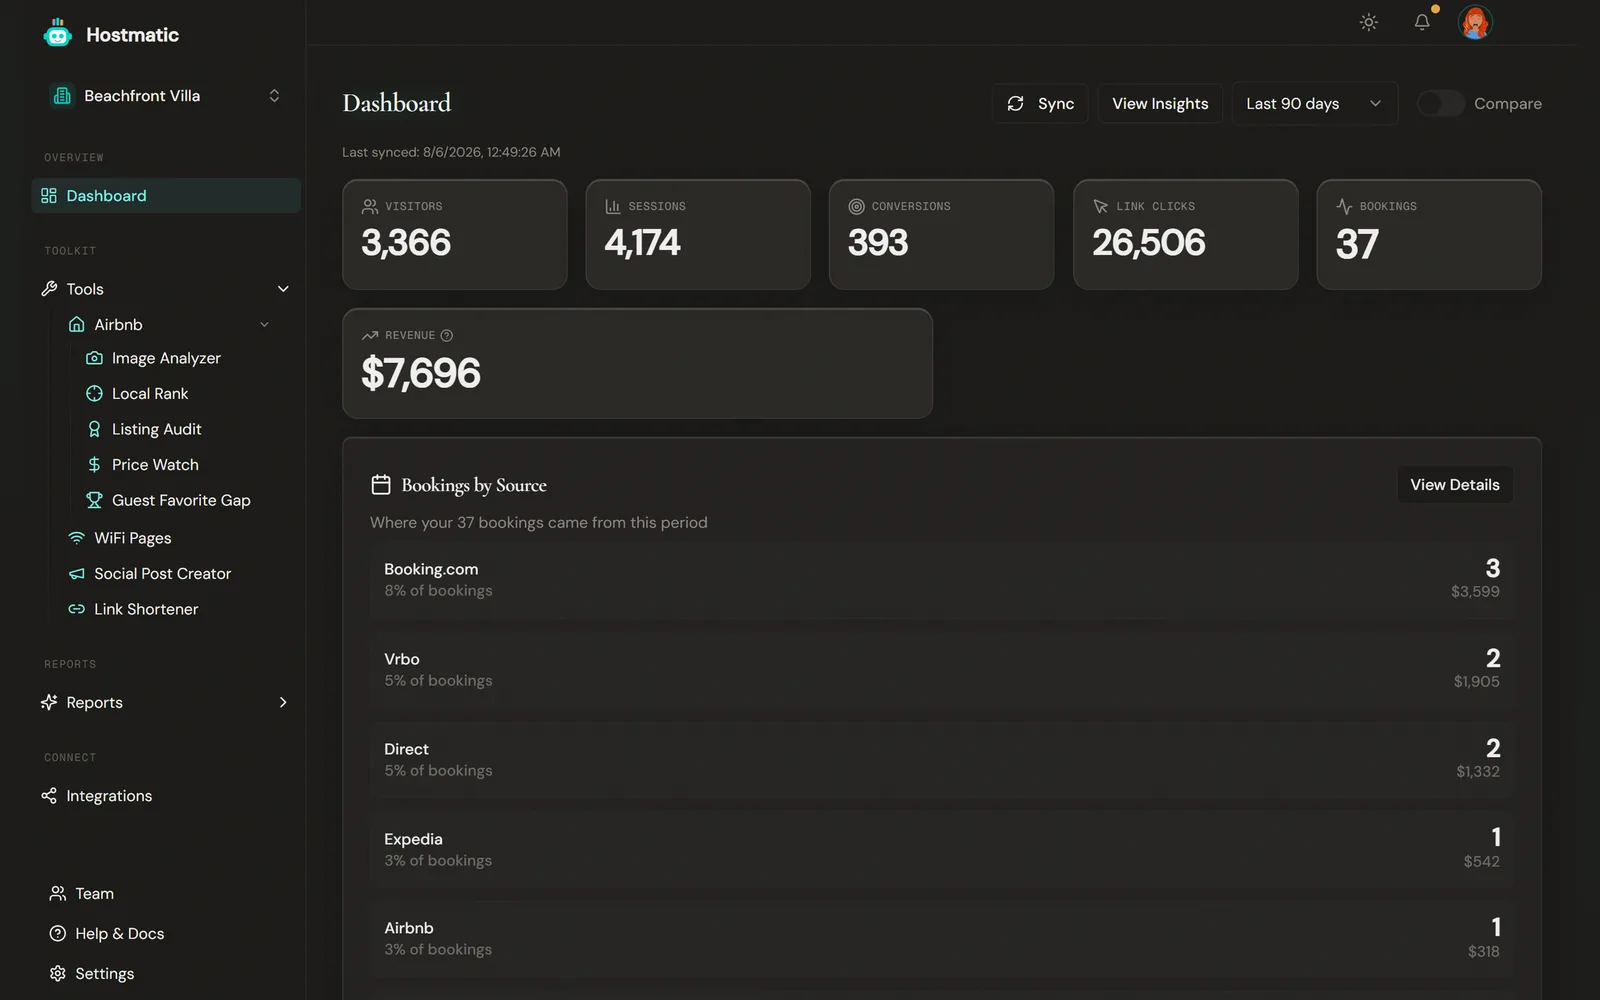
The Dashboard Adapts to You
Before anything else, it helps to know that no two dashboards look the same. What appears depends on:
- Which integrations you've connected — Airbnb calendar, Google Analytics, or a property management system. This is the big one: it decides which stat tiles you get and which cards appear at all.
- Which tools you've run — listing audits, image scans, rank checks and price checks all feed the dashboard once they have results.
- Your plan — a couple of cards and the Compare switch are plan-specific. These are called out where they come up.
So if a card described below isn't on your dashboard, it's almost always because the thing that feeds it isn't connected or hasn't run yet.
Today
The Today card sits at the very top. It's a short, prioritised feed of what's happened across your account — up to five items, with a Show N more button if there are others waiting.
Items are colour-coded on the left edge by how much they need you:
| Edge colour | Meaning |
|---|---|
| Red | Needs attention now |
| Amber | Worth a look |
| Grey | For information |
What can turn up here:
- Ranking moves — your listing climbed or slipped in Airbnb search results
- Google rank changes — position moves, drops, jumps, and new top-10 entries
- Scan reminders — an image scan or rank check has gone stale
- Listing audits — a new audit finished, with its score, or one is due
- Price alerts — a comparable listing moved its pricing
- New reviews and guest sentiment shifts
- Social posts ready to publish, or a nudge to generate this week's batch
- Link activity — a traffic spike on one of your short links, or a click milestone
- AI insights worth surfacing
- Setup steps you haven't finished yet
Most items have a link straight to the relevant page, and a ✕ to dismiss. Dismissed items stay gone. The refresh icon in the card header rebuilds the feed on demand.
When there's genuinely nothing new, the card says so — "Nothing new right now. Check back after your next scan or booking sync." That's a healthy state, not an error.
Get-Started Cards
If you still have setup to finish, a row of cards appears under Today, each with a button through to the right page:
- Connect your Airbnb calendar or Connect Google Analytics — whichever suits your setup
- Finish your website tracking setup — if booking events aren't confirmed working yet
- Run your first listing audit — score your listing and get quick wins; your starter credits cover it
- Create your first tracking link — see where your bookings come from
- Generate this week's social posts — AI-written social content for your property
Cards disappear as you complete them, so an established account sees none.
You don't have to connect an integration first. The listing audit and the social post generator both work from a listing URL, so you can get something useful out of Hostmatic on day one.
Your Stat Tiles
Next comes a strip of five or six stat tiles. Which tiles you get depends on what you've connected — Hostmatic picks the mix that tells you the most, rather than showing blank boxes for data it doesn't have.
| What you've connected | Your tiles |
|---|---|
| Airbnb calendar only | Bookings · Link Clicks · Audit Score · Image Score · Total Reviews · Occupancy |
| Google Analytics only | Visitors · Sessions · Conversions · Link Clicks · Top Source |
| Google Analytics + Airbnb | Bookings · Visitors · Conversions · Audit Score · Revenue |
| Google Analytics + a PMS | Bookings · Revenue · Visitors · Conversions · Top Source |
| Airbnb + a PMS | Bookings · Revenue · Audit Score · Image Score · Total Reviews |
| A PMS only | Bookings · Revenue · Nights · Avg ADR · Lead Time |
If you have Google Analytics and your Airbnb calendar and a PMS, you'll see the Google Analytics + Airbnb mix.
With nothing connected yet, the strip is hidden entirely — Today and the get-started cards do the talking instead.
A few notes on individual tiles:
- One tile in each strip is highlighted in brand teal. That's the number that matters most in your setup — usually Bookings, Conversions or Revenue.
- Revenue comes from a connected property management system or channel manager, such as Guesty or OwnerRez. Hover the info icon to confirm the source. It only appears if you have one connected.
- Audit Score and Image Score are averages across your Airbnb listings, out of 100. Total Reviews is your review count. These fill in once you've run a listing audit or image scan.
- Link Clicks covers your Hostmatic short links and QR codes. Normally it's all-time; with Compare switched on it narrows to the selected period so the change figure means something.
- Top Source is where most of your website visitors came from.
- A tile shows — when the data behind it hasn't arrived yet. Run the relevant scan or wait for the next sync.
A note on connecting things: Google Analytics and the PMS connectors (Guesty, OwnerRez) are available on Weekend Host and Pro Host. On the Free plan you can connect your Airbnb calendar, which is why Free accounts see the Airbnb tile mix.
Date Range and Comparison
In the top-right corner of the dashboard:
- Date range dropdown — Last 7 days, Last 14 days, Last 30 days, Last 90 days, Last 6 months or Last year
- Compare (Pro Host) — switch it on to add change figures to your tiles and a dashed previous-period line to the visitor chart. An up arrow means an increase, a down arrow a decrease. Free and Weekend Host don't see this switch.
Compare works on the Visitors, Sessions, Conversions, Bookings, Revenue and Link Clicks tiles. Audit Score, Image Score, Total Reviews, Occupancy, Nights, Avg ADR, Lead Time and Top Source have no previous-period figure and always show the selected period only.
If your previous period has no data at all — common on a new account — Hostmatic tells you that outright rather than showing you empty arrows.
Sync and View Insights
Sync (the circular arrow) pulls the latest Google Analytics data. It's available once Google Analytics is connected, and a Last synced time appears just below the header. If your only connection is your Airbnb calendar, there's no Sync button — the "Last synced" time reflects your calendar sync instead.
View Insights opens Reports → Overview for the fuller reporting set.
Tip: If you've just changed your Google Analytics property or your website, give it a few minutes to propagate before syncing.
Banners
Alerts appear above the cards when something needs fixing — an integration that stopped collecting data, an expired Google connection, or a failed sync. Each one comes with a button through to the fix.
Bookings by Source
With your Airbnb calendar or a PMS connected, Bookings by Source breaks down where your bookings came from this period, with each source's share and its revenue where known. View Details opens the full Bookings report.
This is the card that answers Hostmatic's core question — where are my bookings actually coming from?
Airbnb Cards
With your Airbnb calendar connected, three more cards appear:
- Airbnb Calendar Highlights — upcoming bookings, current guests, total nights and occupancy
- Link Performance — your top three links by clicks, with View All Links through to the Marketing report
- Recent Posts — your latest generated social posts, with Create Post
If one of these can't load, it says so and offers a retry — it won't quietly pretend you have no data.
Detailed Analytics
With Google Analytics connected, a Detailed Analytics section sits lower down. It's expanded by default and collapses with a click if you'd rather keep the page short. Inside:
- Visitor Overview — daily visitors across your selected date range. Hover any point for that day's exact count. With Compare on, a dashed second line shows the previous period.
- Traffic Sources — where your visitors came from, as a ranked horizontal bar chart. Groups include Direct, Social, Search, Referral and Campaigns.
- Blog Performance (Weekend Host and Pro Host) — views, visitors, conversion rate and conversions for pages matching your blog URL pattern. The default is
/blog; change it in the Blog / Content card on the Integrations page. - Key Events Breakdown — your Google Analytics key events grouped by type and sorted by volume, so you can see which actions visitors take most. It appears only when your site is sending key events.
Recent Activity
At the very bottom, Recent Activity lists your last eight actions across the app — rank scans, image scans, listing audits, price checks, published social posts, links created and clicked, booking syncs, and integrations connected or disconnected. Each row shows how long ago it happened and, where relevant, which listing it was for. Click a row to open the tool behind it.
AI Insights
AI-generated insights live on the AI Insights page under Reports in the sidebar, not on the dashboard. Free sees 3, Weekend Host 6 and Pro Host 10.
Property Switcher
If you manage more than one property, use the property dropdown at the top of the sidebar to switch between them. Every metric, chart and card on the dashboard updates to the selected property. Free includes 1 property, Weekend Host 2 and Pro Host 5.