
What Hostmatic Tracks
Core Metrics
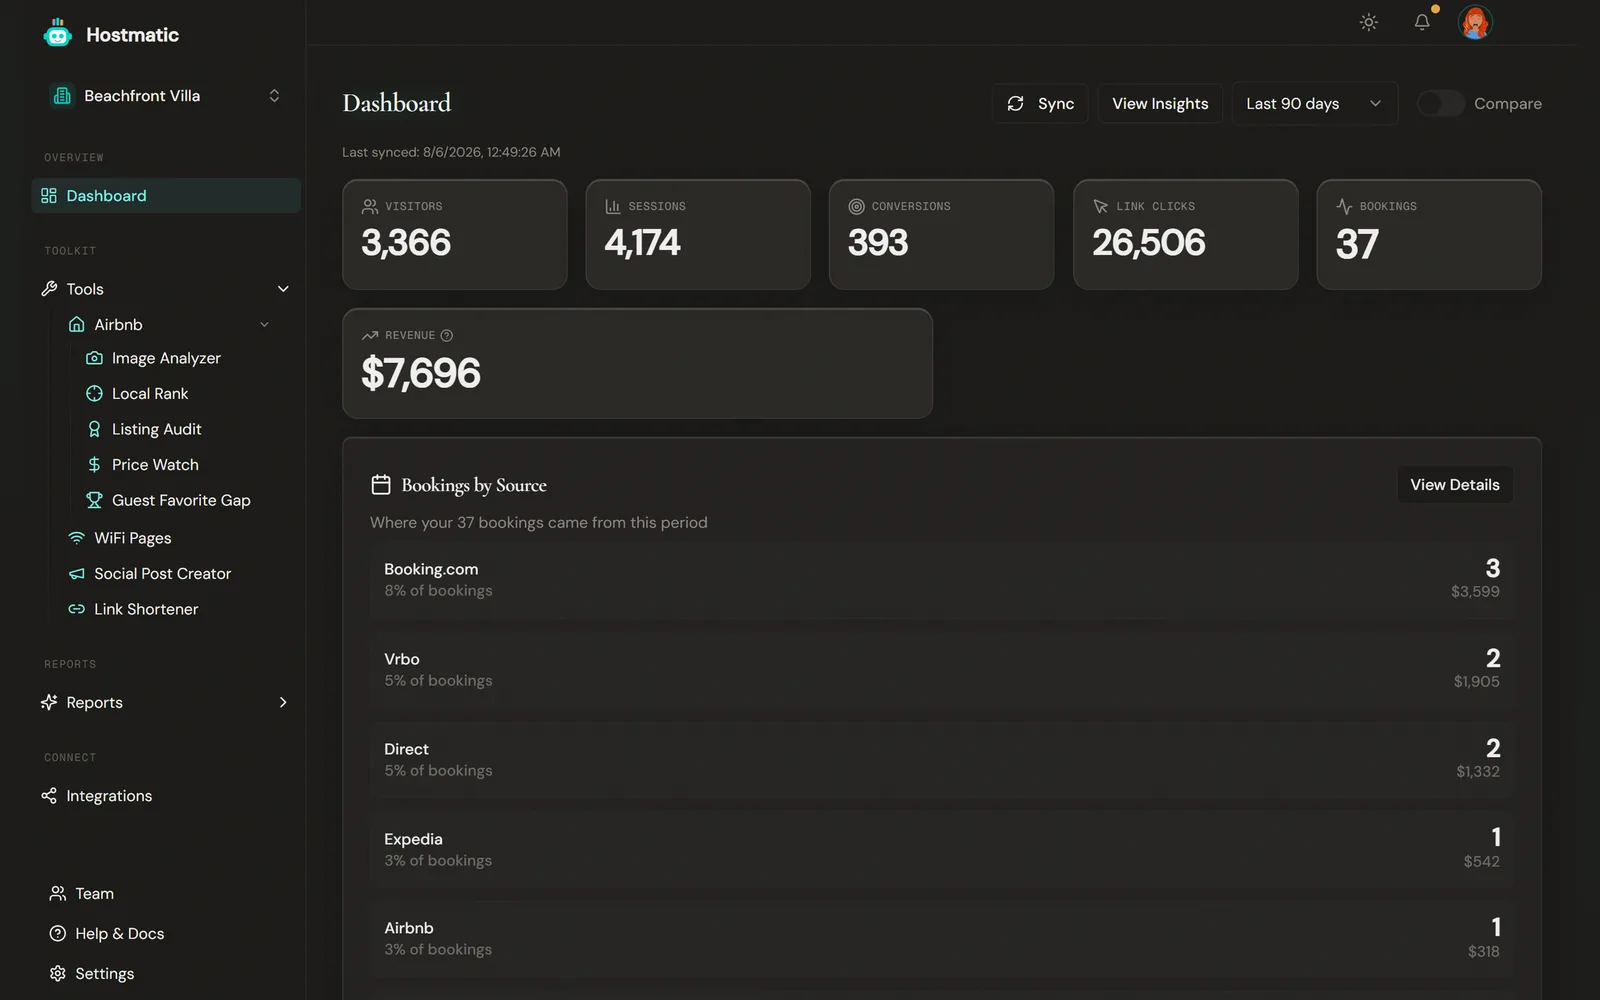
Your dashboard shows a strip of five or six stat tiles. Which tiles you get depends on what you've connected — Hostmatic picks the mix that tells you the most rather than showing empty boxes. The full set it draws from:
| Metric | What It Measures | Data Source |
|---|---|---|
| Visitors | Unique visitors to your direct booking site | Google Analytics |
| Sessions | Total browsing sessions | Google Analytics |
| Conversions | GA4 key events completed | Google Analytics |
| Link Clicks | Clicks and QR scans on your tracking links | Hostmatic link tracker |
| Bookings | Confirmed reservations | Guesty, OwnerRez or Airbnb calendars |
| Revenue | Total booking revenue | Your PMS or channel manager |
| Top Source | Where most of your visitors came from | Google Analytics |
| Audit Score / Image Score / Total Reviews | Listing health averages | Your Airbnb listing scans |
| Occupancy | Share of nights booked | Your Airbnb calendar |
| Nights / Avg ADR / Lead Time | Stay length, nightly rate, booking lead time | Your PMS |
With only your Airbnb calendar connected — the Free plan setup — you'll see Bookings, Link Clicks, Audit Score, Image Score, Total Reviews and Occupancy. The Dashboard Overview lists the exact mix for every combination.
Further down the page, Traffic Sources shows where your visitors come from.
Additional Data Points
- Today feed — what changed since your last visit: ranking moves, new reviews, finished scans, posts ready to publish
- Blog performance — Views, visitors, and conversions from your blog content (Weekend Host+)
- Traffic sources — Breakdown of where your visitors come from (organic, social, direct, referral)
- Key events — Conversion events by type, sorted by volume
- Recent activity — your last eight actions across the app
- AI-generated insights — See Reports → AI Insights
If an integration disconnects, a banner appears on the dashboard with a reconnect button.
How Data Flows Into Hostmatic
- Google Analytics (Weekend Host+) — Connect your GA4 property via OAuth. Hostmatic syncs visitor, session, conversion, and traffic source data. If you've connected GA4, use the Sync button on your dashboard to pull the latest data.
- Airbnb Calendars — Add your iCal export URLs. Hostmatic reads booking dates to track occupancy and reservation counts.
- Guesty or OwnerRez — Connect your PMS to add revenue, booking details and lead time. Guesty needs Weekend Host or higher and uses a Client ID and Client Secret from Guesty's Integrations → API & Webhooks settings.
- Link Tracker — Every short link tracks clicks, QR scans and unique visitors. Device, browser, referrer and country breakdowns are on Pro Host.
- Social Accounts — Connect your social accounts to publish posts directly to Instagram, Facebook, X, Pinterest, and LinkedIn (Weekend Host+). Organic social performance is tracked via Google Analytics. Paid ad reporting comes from the separate Ad Accounts connector (Pro).
- Direct Booking Website and Blog / Content — Connect these from Integrations to track your own site and blog pages.
Date Ranges and Comparison
Most reports have a date range selector:
- Last 7 days — Quick snapshot of recent activity
- Last 14 days — Two-week trend view
- Last 30 days — Monthly performance
- Last 90 days — Quarterly trends
- Last 6 months and Last year — Longer ranges for trend and seasonal analysis
How far back Hostmatic actually keeps data depends on your plan: Free 90 days, Weekend Host 180, Pro Host 365. Funnel Analysis hides ranges beyond your limit; other pages still list all six but only show data inside your window.
Seasonal Patterns uses its own selector: Last 6, 12 or 24 months. The Airbnb tool history tables default to 90 days.
Tip: Period-over-period comparison (current vs prior period side-by-side) is a Pro Host feature. Look for the Compare toggle next to the date range selector.
Understanding Your Data
Percentage Changes
Green arrows (up) and red arrows (down) next to metrics show the change compared to the previous period. A green arrow on visitors means more people visited your site compared to the same number of days prior.
Data Freshness
Your dashboard shows a "Last synced" timestamp (GA4, or your Airbnb calendar if you don't use GA4). If data looks stale, click the sync button to pull the latest from Google Analytics.
Property Context
If you manage multiple properties, use the property switcher in the sidebar to view data for a specific property. All metrics, charts, and insights update to reflect the selected property.
Next Steps
- Connect Google Analytics to start tracking visitors
- Create your first tracking link to measure marketing performance
- Explore your dashboard to understand each section
- Map the Reports section to figure out which page answers your current question