
Requires Weekend Host or Pro Host. On Free, a lock icon appears next to this item in the sidebar.
How to Access
- In the sidebar, click Reports to expand the menu
- Click Seasonal Patterns, under the Patterns label at the bottom of Reports
The ? button next to the page title opens "About this page".
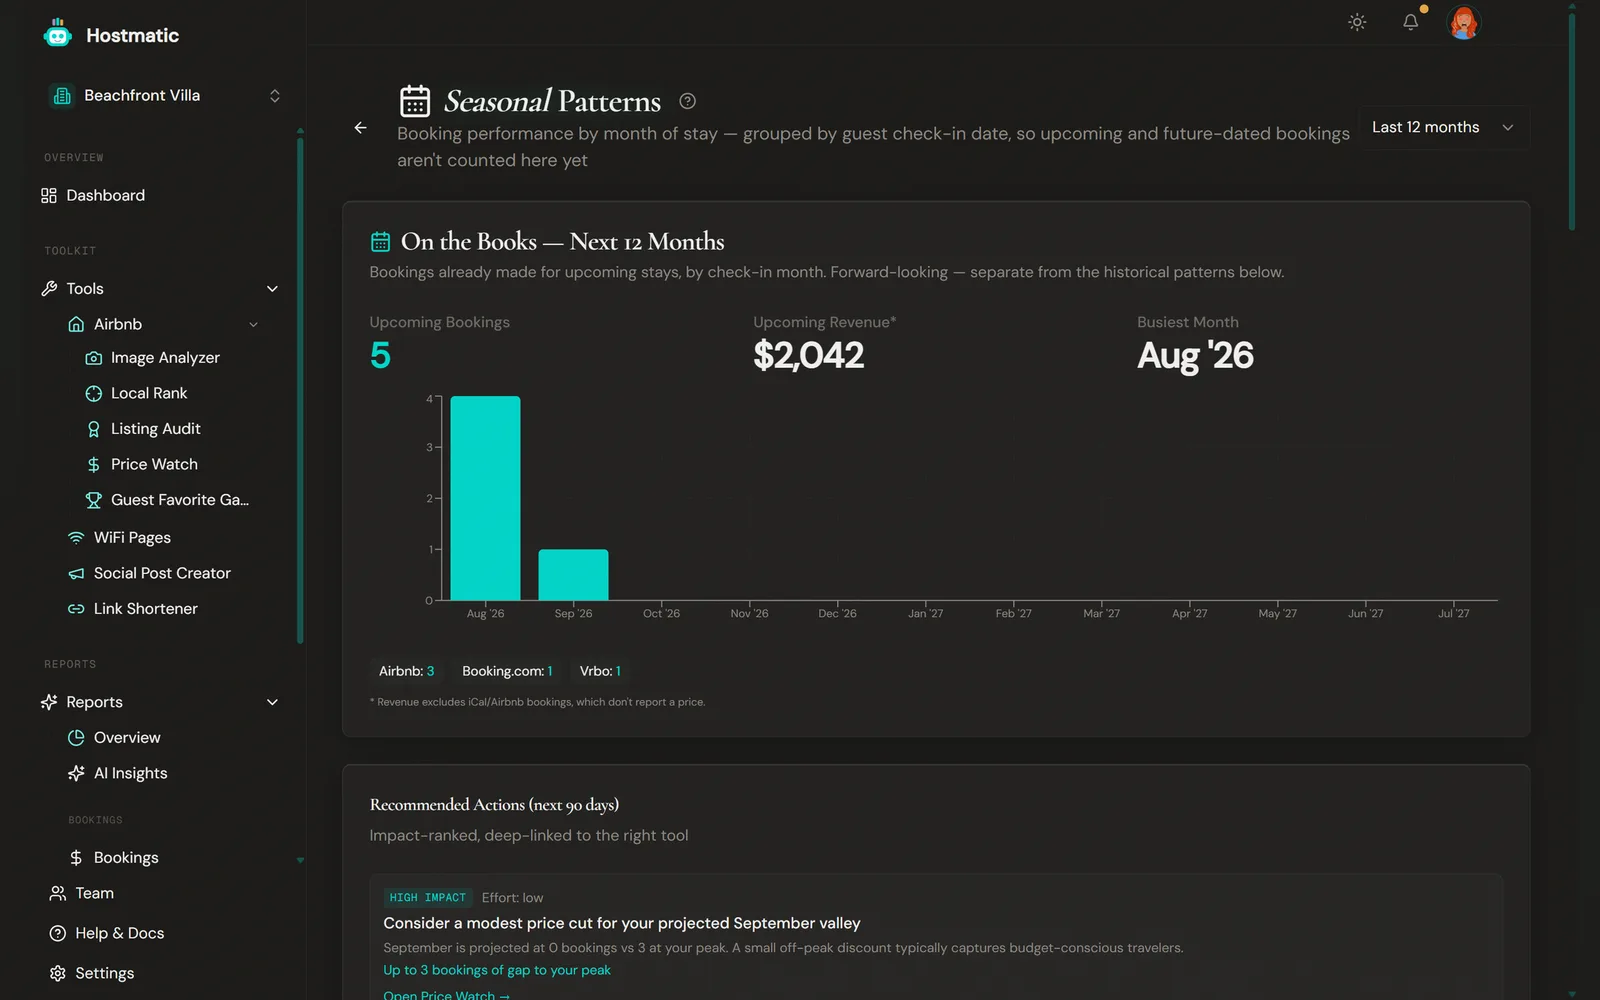
What You'll See on the Page
Bookings are grouped by check-in month, so upcoming stays don't appear in the historical charts. They appear in On the Books — Next 12 Months instead.
- Data Period — How many months of historical data you have
- On the Books — Next 12 Months — Upcoming bookings, upcoming revenue, your busiest month ahead, and a bar chart. Shows even with little history.
- Recommended Actions (next 90 days) — Ranked HIGH / MEDIUM / LOW by impact, with the effort involved and a link to the right tool
- Seasonality Index — How much your bookings vary by month, as a %. Under 20% is Very Stable, 20–39% Moderate, 40–59% Seasonal, 60%+ Highly Seasonal.
- Peak Month and Low Month — Highest and lowest demand, with total bookings. Months before your data starts are excluded, not counted as zero.
- Monthly Booking Distribution — Bookings by month with an average line, plus Filter Channels (the top 4 channels are on by default)
- Channel Performance by Month — A line chart per channel, with cards for total bookings, total revenue, best month, worst month and a recommendation. Revenue needs a connected PMS.
- Booking Lead Time by Month — How far in advance guests book, by check-in month (needs a connected PMS)
- Market Comparison — With 6+ months of data and a city on your property, shows whether your peak month matches the local market and whether you're more or less seasonal than peers
- Unfillable Vacancy Gaps — Gaps between bookings too short to fill at your current minimum stay, by month, with a minimum-stay suggestion
- Seasonal Breakdown by Listing — A month × listing heatmap of bookings (2+ listings, up to 12 shown)
- Seasonal Amenity Tips — Per listing, amenities worth featuring before its slow season, with a "Photo gap" badge and a link to Social Post Creator
- Seasonal Recommendations — A summary list of suggested next steps
- Date range selector — Use the dropdown in the top-right to choose the last 6, 12 or 24 months. It defaults to 12.
With under 6 months of data you'll see a Not Enough Data state with a Go to Integrations button.
Identifying Patterns
The page labels your Peak Month and Low Month. Reading the monthly distribution yourself will usually show more:
- Peak seasons — Months with consistently high bookings (summer for beach properties, winter for ski)
- Shoulder seasons — Transition periods with moderate demand
- Off-peak periods — Low-demand months where marketing can make the biggest difference
- Holiday spikes — Short-term surges around holidays or local events
How to Use This Data
Marketing Timing
Launch promotions before your off-peak periods. If bookings typically drop in October, start running campaigns in September. Go to Tools → Social Post Creator in the sidebar to create seasonal content.
Pricing Strategy
Identify your peak periods to adjust pricing confidently. Seasonal data gives you evidence for premium pricing during high-demand months.
Content Planning
Promote summer activities in spring, and cozy winter getaways in fall. Align your social media calendar with your seasonal patterns.
Tip: The more historical data you have, the more reliable your seasonal patterns become. The page asks for at least 6 months, so keep your integrations connected continuously.
Data Sources
Seasonal data is compiled from:
- Guesty or OwnerRez — Bookings, revenue and lead time. Guesty needs Weekend Host or higher.
- Airbnb Calendars — Booking dates (no revenue)
- Google Analytics — Counts toward your months of data; the charts themselves show bookings
Connect these from the Integrations page in the sidebar.